Data-driven decision-making is more than a buzzword— it’s the key to long-term business success. Using KPIs and performance metrics quantifies the customer experience and provides valuable insights on where to allocate resources and how to make measurable improvements.
If the goal is business growth, customer experience metrics can showcase where the opportunity lies to strengthen customer loyalty and acquire new qualified leads.
Here are the top ten customer experience metrics to grow your business, whether you’re just starting or have an established enterprise.
Net Promoter Score
The Net Promoter Score (NPS) is one of the most popular success metrics that businesses use to get a high-level overview of the customer experience. It’s also one of the most straightforward direct feedback requests to administer to customers and turn into useful information.
In simple terms, the NPS measures how likely your customers are to recommend your business to their friends or colleagues. This measurement is often evaluated on a scale of 1-5, with one meaning “would not recommend” and five meaning “would highly recommend.” Some companies use a larger scale in an attempt to dive into the minutiae.
Responses are then categorized into percentages, with the lower levels labeled as “detractors” and the higher levels labeled as “promoters.” Those that fall in the middle are often referred to as passive or neutral respondents. A company can then use this metric to measure the ratio of people who are satisfied with those who are not.
Keep in mind that the NPS is a 30,000-foot view of the customer experience. It’s a highly simplified equation that doesn’t clearly identify areas of improvement. It’s also important to remember that someone saying they’d recommend your company doesn’t mean they’re taking action to do so. However, this number can provide a simple snapshot of your customer experience when the goal is growth.
Customer Lifetime Value
Customer lifetime value (CLV) is another standard business metric when setting growth-related goals. This data is particularly useful for established companies that are taking the next step toward scaling. The CLV outlines the profitability of an individual customer throughout their relationship with the business. This metric provides insights into where businesses should target marketing and growth efforts for the best possible return on investment.
The simplest way to measure CLV is:
(Average order cost x Average purchases per year) x Length of patronage in years
Using the CLV formula can showcase some surprising information about which customers are truly loyal.
Take a restaurant, for example. A regular customer might come in alone once a month and have a meal for years. A new customer might come in twice per year for a few years with their whole family for a big party. At a glance, the latter customer seems like the one to please. However, the CLV shows differently.
That first customer’s CLV might be:
($30 average order x 12 purchases per year) x 10 years = $3,600 CLV
The second customer’s CLV might be:
($300 average order x 2 purchased per year) x 5 years = $3,000 CLV
This metric quantifies customer loyalty and value over time. The better the overall customer experience, the higher the CLV. There are also in-depth equations that can calculate the CLV in connection with specific campaigns and marketing strategies. Invest in an AI-driven CRM system to dig deep into these numbers.

Average Time to Resolution
Customer support and service calls provide some of the most useful data when quantifying the customer experience. Average Time to Resolution (ATR)— sometimes called Average Resolution Time (ART) or Time to Resolution (TTR)— measures how long it takes to solve a customer’s problem. The longer the ATR, the more likely your customer is to report a negative experience.
Measuring the ATR can help identify if your customer service efforts need work. This is a foundational component of your business that needs to be addressed before you grow. It’s also a useful metric to use during a scale-up strategy, as it identifies if you’re maintaining your quality of service as the business changes.
If your ATR starts to grow, you’ll know that you need to offer training on how to conduct best contact center software practices and ensure you have enough staff.
First Call Resolution
First call resolution goes hand-in-hand with ATR. This KPI indicates how many times a customer has to contact you or be contacted before an issue is resolved. As with ATR, the lower this number, the better.
Your first call resolution statistics indicate if your staff is inadequately trained or if there are critical issues within your business processes. Again, this is an important metric to stay on top of when scaling and growing your business.
It’s important to find a tracking program that allows you to take an omnichannel approach to measuring this KPI. A customer could contact you through social media before calling. For the number to be accurate, you’ll need a convergence method between your various channels.
Abandonment Rate
The abandonment rate is a versatile KPI that can cover any number of contact points in your business. Some common abandonment rate sources to consider include:
- Browse abandonment
- Cart abandonment
- Call abandonment
- Bounce Rate
- Last Page
The idea behind this measurement is simple: it indicates where your customers gave up before completing a task.
Browse abandonment and cart abandonment often take place within an E-Commerce site. The browse abandonment metrics showcase what a customer was looking at before they left the site. Cart abandonment shows that the customer got to the next step in the sales process and then left. Both can be retargeted with AI-driven automated email flows. This data can also indicate a deeper customer experience issue, whether it’s pricing or friction during the check-out process.
Similarly, call abandonment shows how long a customer waited for support before giving up. A high call abandonment rate indicates that the customer service process needs work.
The bounce rate shows how many people are leaving your website without completing a purchase. It’s frequently used by bloggers to determine whether their content connects with readers. It can also be used in E-Commerce businesses to identify any friction points or bottlenecks during the sales process. Other businesses can also use this metric, combined with the last page visited, to determine if a certain area of the website needs work. It doesn’t take long for a user to get frustrated and move onto the competition if something is amiss.

Customer Churn Rate
Your customer churn rate is another important metric to pay close attention to as you grow your business. This number represents the customers who have completed at least one transaction and then never returned. You can narrow down your churn rate to look at various scenarios, such as one-and-done customers or churn within a specific timeframe.
While using the churn rate metric is beneficial at any phase of the business, it becomes particularly important during periods of growth. Churn rate can provide deeper insights into the customer experience and what actions retain or deter customers. For example, you should always evaluate your churn rate after new products are launched, or you make changes to your customer service processes.
The churn rate can also determine if your focus should lie on triggering a second sale or finding new value-added offerings for repeat customers. Keep in mind that it’s normal to have some churn— not every customer who tries out your business is your ideal customer. Many businesses aim for a churn rate of under 10% as a starting point.
Customer Satisfaction Score
Like the NPS, the Customer Satisfaction Score (CSAT) is a simple means of getting a high-level view of your company’s customer experience. The CSAT also uses a quick, scaled approach, often delivered as a survey immediately following a transaction. The question asked in the CSAT is, “are you satisfied with your experience?” It doesn’t get any more straightforward than that!
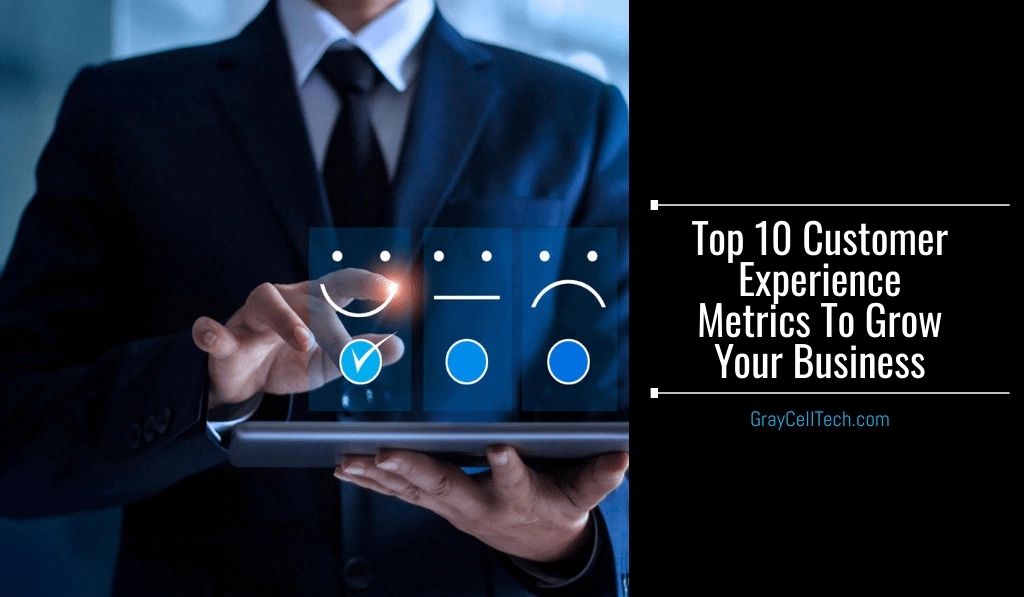
The CSAT is the average of the scaled responses, whether it’s calculated on a scale of 1-10 or using three emoticons depicting various emotions. The main challenge with the CSAT is that it’s an oversimplification of a complex answer. However, that directness gives an accurate summary of how your business growth is tracking. If the CSAT starts to go down, you have a problem. If you implement changes to your customer service interactions and see it move upward in response, you’ve made the right decision.

Customer Effort Score
Like the abandonment rate, the Customer Effort Score (CES) can be applied to a number of interactions. The CES quantifies how simple or challenging a customer found an interaction with the business. This metric can be applied to:
- Point of sale and transaction completion
- Customer service interactions
- Store navigation
- General experience with a business
The CES is a fantastic metric for determining where a customer experiences friction during a task so that your business knows where to focus its improvement activities.
This quantifier tends to interact with other metrics. During a support call, the CES will correlate with the ATR. At any point, it could directly relate to the CSAT. You can use this data point as a standalone measurement or in conjunction with other metrics for a more in-depth depiction of what’s happening in your business.
Website Traffic Analytics
In addition to the bounce rate and the last page visited, there are numerous website traffic analytics that can give businesses a better idea of the customer experience. Fortunately, Google Analytics is a free service that businesses of any size can use to determine what’s happening behind the scenes on their website.
One of the simplest metrics to measure from website traffic analytics is the monthly page views and monthly new visitors. Ideally, your website will track upward over time. You can also see where people are going on your site and where they originated from— direct links, social media, Google, etc. This separation is particularly useful when measuring customer experience, as you can differentiate who is coming to your site from SEO efforts versus an existing relationship with your brand.
Another effective way to get useful data about the customer experience is to set event and goal triggers. An event will measure when customers click through a certain link or complete a transaction. A goal metric helps create targets and measure performance over time.

Online Reviews and Ratings
Finally, another simple metric that can help businesses grow and thrive is the state of its online ratings and reviews. Many consumers look at online reviews before making a purchasing decision. Thus, monitoring and using reviews to make data-driven business decisions is essential for success.
Keep in mind that negative reviews are also beneficial, as they provide insights into where you’re falling short in the customer experience world. Look at these data points as directions for how to improve.
With these top ten KPIs, you can track your customer experience and successfully grow your business.


